
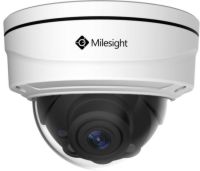
As a built-in statistical behavior analysis, ULTRA Heat Map function is an advanced technology. Heat maps can provide information about the density of activity in different areas, which can be used to optimize the operations of businesses and public services. For example, it can help retailers understand which areas are their most popular product display areas, so that they can better optimize their products and services.
Real-time Customer Tracking
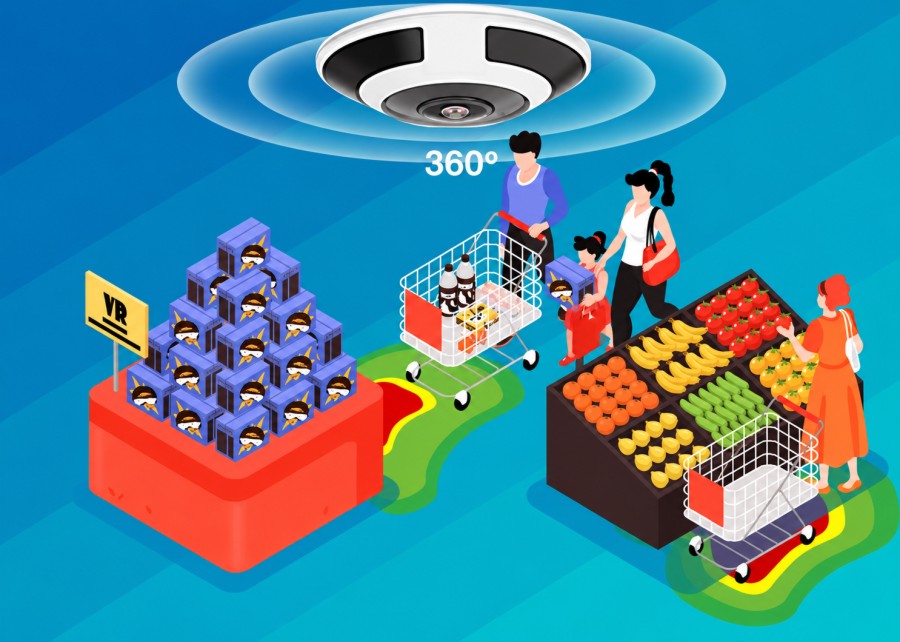
Track and record the path and actions of your customers in your stores in real-time to ensure proactive monitoring, that intuitively displays the distribution of pedestrian or crowd density, making it easier to understand and analyze.
Optimizing Operations
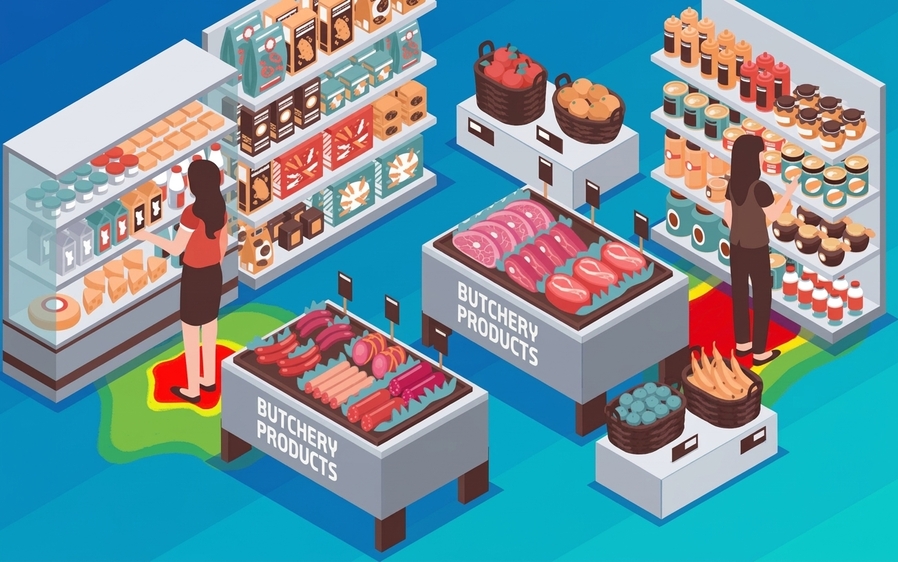
By comparing heat maps of different time periods or locations, trends and changes in pedestrian or crowd density can be recognized, aiding in more accurate predictions and decision-making.
Detailed Reports for Managers
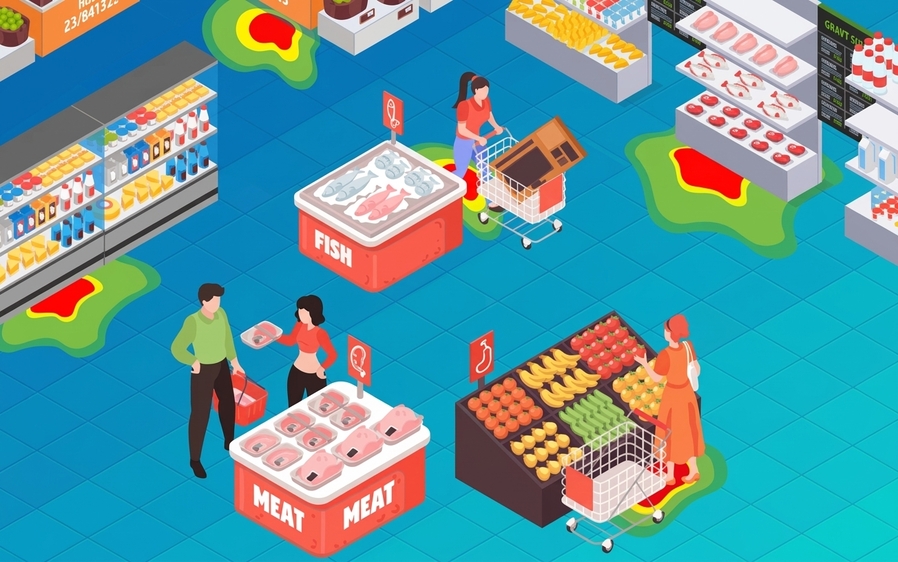
To use ULTRA Heat Map function camera, it just needs one ULTRA panoramic camera - no additional equipment required. It can be easily set up and provide crucial data support to help managers make more accurate predictions and decisions.
Frequently Asked Questions
Check the exact model and firmware in the current datasheet or compatibility documentation, then request written confirmation for the quoted configuration. Confirm supported camera types, coverage and mounting constraints, counting assumptions, aggregation interval, export format, privacy requirements, and platform compatibility.